I am a Canadian data scientist and software engineer currently
living in Australia. I have extensive experience in applied
statistics, machine learning, lean and agile methodologies, R,
Bayesian analysis, and data pipelines.
For the last six years, I developed solutions for market
research and business intelligence software that enabled customers to
automate the cleaning, statistical analysis, visualization, and
reporting of their survey data.
I am an experienced Scrum Master and Agile practioner, certified
as a SAFe Practice Consultant (SPC) and RTE. Please contact me if
you are interested in training or coaching.
Previously, I was an academic researcher
in applied statistics specializing in statistical computing,
semiparametric and high-dimensional regression, time series
analysis, and hierarchical Bayesian modelling. I am passionate about
software development and love working with data from a diverse range
of fields: market research, finance, nutrition, and many others.
M. W. McLean,
M. P. Wand.
Variational Message Passing for Elaborate Response
Regression Models.
In: Bayesian Analysis 14.2 (Jun. 2019), pp. 371–398.
[PDF]
K. Triff, M. W. McLean,
E. Callaway, J. Goldsby, I. Ivanov,
and R. S. Chapkin.
Dietary Fat and Fiber Interact to Uniquely Modify Global
Histone Post-Translational Epigenetic Programming in
a Rat Colon Cancer Progression Model.
In: International Journal of Cancer 143.6 (May 2018), pp. 1402–1415.
M. W. McLean (2017). RefManageR: Import and Manage
BibTeX and BibLaTeX References in R. Journal of Open Source
Software. R package also accepted
to ROpenSci.
[JOSS |
GitHub
| Reports]
K. Triff, M. W. McLean, K. Kranti, J. Pang,
E. Callaway, B. Zhou, I. Ivanov,
and R. S. Chapkin. Assessment of
Histone Tail Modifications and Transcriptional Profiling
During Colon Cancer Progression Reveals a Global Decrease in
H3K4me3 Activity.
In: BBA - Molecular Basis of Disease 1863.6 (Jun. 2017), pp. 1392–1402.
[Elsevier]
M. W. McLean, G. Hooker,
D. Ruppert. Restricted Likelihood Ratio
Tests for Linearity in Scalar-on-Function Regression.
In: Statistics and Computing 25.5 (Sep. 2015),
pp. 997–1008.
[arXiv
| Springer]
M. W. McLean, G. Hooker,
A.-M. Staicu,
F. Scheipl, D. Ruppert. Functional
Generalized Additive Models. In: Journal of Computational
and Graphical Statistics 23.1 (Feb. 2014),
pp. 249–269.
[T & F Online
| Supplementary
Materials]
M. W. McLean, C. J. Oates,
M. P. Wand (2017). Real-Time
Semiparametric Regression via Sequential Monte Carlo.
[PDF]
M. W. McLean, F. Scheipl, G. Hooker, S. Greven, D. Ruppert (2017). Bayesian
Functional Generalized Additive Models for Sparsely Observed
Covariates.
[arXiv]
M. W. McLean (2014). Straightforward Bibliography
Managament in R Using the RefManageR Package.
[arXiv]
PhD Thesis
On Generalized Additive Models for Regression with
Functional Data (2013). School of Operations Research and
Information Engineering, Cornell University.
[PDF]
Note: The HTML5 slides below may be printed in any decent browser by 'right-clicking' on any slide and selecting 'print'.
Restricted Likelihood Ratio Tests for Functional Regression
2014 WNAR/IMS Conference, Honolulu, HI (2014)
2014 ENAR Spring Meeting, Baltimore, MD (2014)
Tools for Reproducible Research and Dynamic Documents in R
IAMCS Machine Learning and Applied Statistics Workshop
Series, College Station, TX (2014)
[Slides (HTML)]
(These slides also contain a brief introduction to
my R
package RefManageR)
Intermediate R Programming and Authoring R Packages
IAMCS Machine Learning and Applied Statistics Workshop Series, College Station, TX (2014)
[Slides (HTML)]
Functional Generalized Additive Models
Department of Statistics, University of Auckland,
Auckland, New Zealand, August, 2017
Annual Meeting of the German and Austrian Statistical
Associations, Vienna, Austria (2012)
[Slides
(PDF)]
ORIE PhD Colloquium, Ithaca, NY (2012)
[Slides (PDF)]
Posters
Functional Generalized Additive Models
ORIE PhD Reunion / Jack Muckstadt Retirement Celebration, Ithaca, NY (2012)
[Poster (PDF)]
Statistical Methods for Very Large Datasets Conference, Baltimore, MD (2011)
SAMSI Analysis of Object Data Closing Workshop, Research Triangle Park, NC (2011)
Imaging, Communications and Finance: Stochastic Modeling of Real-world Problems, New York, NY (2011)
[Poster (PDF)]
My postdoctoral research focused on building models
and algorithms for high-dimensional and streaming data
applications. Specifically, approximations
to fully Bayesian inference such as variational Bayesian
methods. Additonally, I worked on developing semiparametric models to
analyze longitudinal and functional data. I have a passion
for statistical computing and reproducible research, and have
contributed to a number of R packages
on CRAN.
Previous areas of application have included diffusion
tensor imaging, forecasting emergency medical service call
arrival rates, differential expression analysis of RNA-Seq
data, analyzing step counts from wearable activity trackers,
measurement error modelling for dietary intake data, and
financial time series. Below is an introduction to a couple
of applied problems I have worked on.
Functional Generalized Additive Models
We have data from a study comparing certain white matter tracts of multiple sclerosis (MS) patients with control subjects.
MS is a central nervous system disorder that leads to lesions in the white matter of the brain which disrupts the ability of cells in the brain to
communicate with each other. Below is a human brain with two major white matter tracts, the corpus callosum and corticospinal tracts in red and blue,
respectively (thanks to Jeff Goldsmith).
Using a Magnetic Resonance Imaging technique called Diffusion Tensor Imaging we obtain several measurements at each location in the white matter tracts.
Here it makes sense to treat these measurements as being from a continuous function X(t) where t is location along the tract and use tools from functional data analysis.
We wish to use the functions X(t) to predict a scalar health outcome Y. For example, Y might be score on a cognitive test or disease status (case or control).
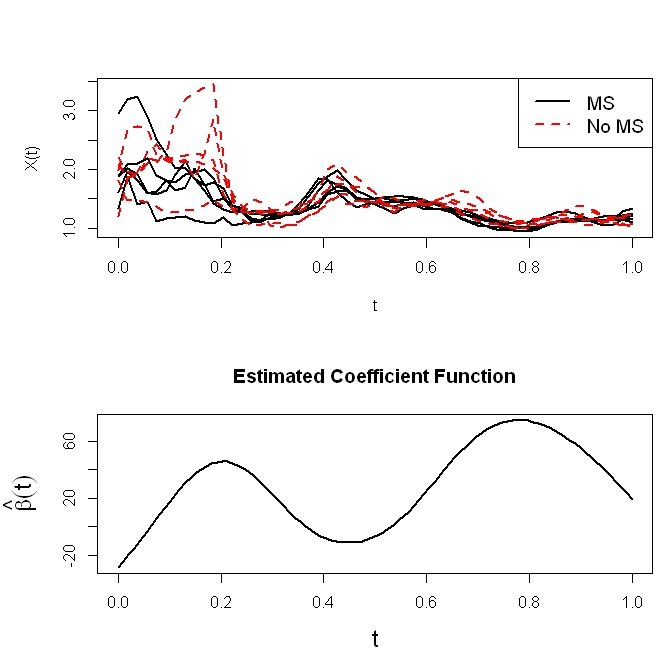
The typical approach in functional data analysis is to use the Functional Linear Model (FLM)
where β(t) is an unknown coefficient function that needs to be estimated and g(•) is a known monotonic function called the link function. Below is a plot of some of the curves Xi(t) as well as a corresponding estimated β(t).
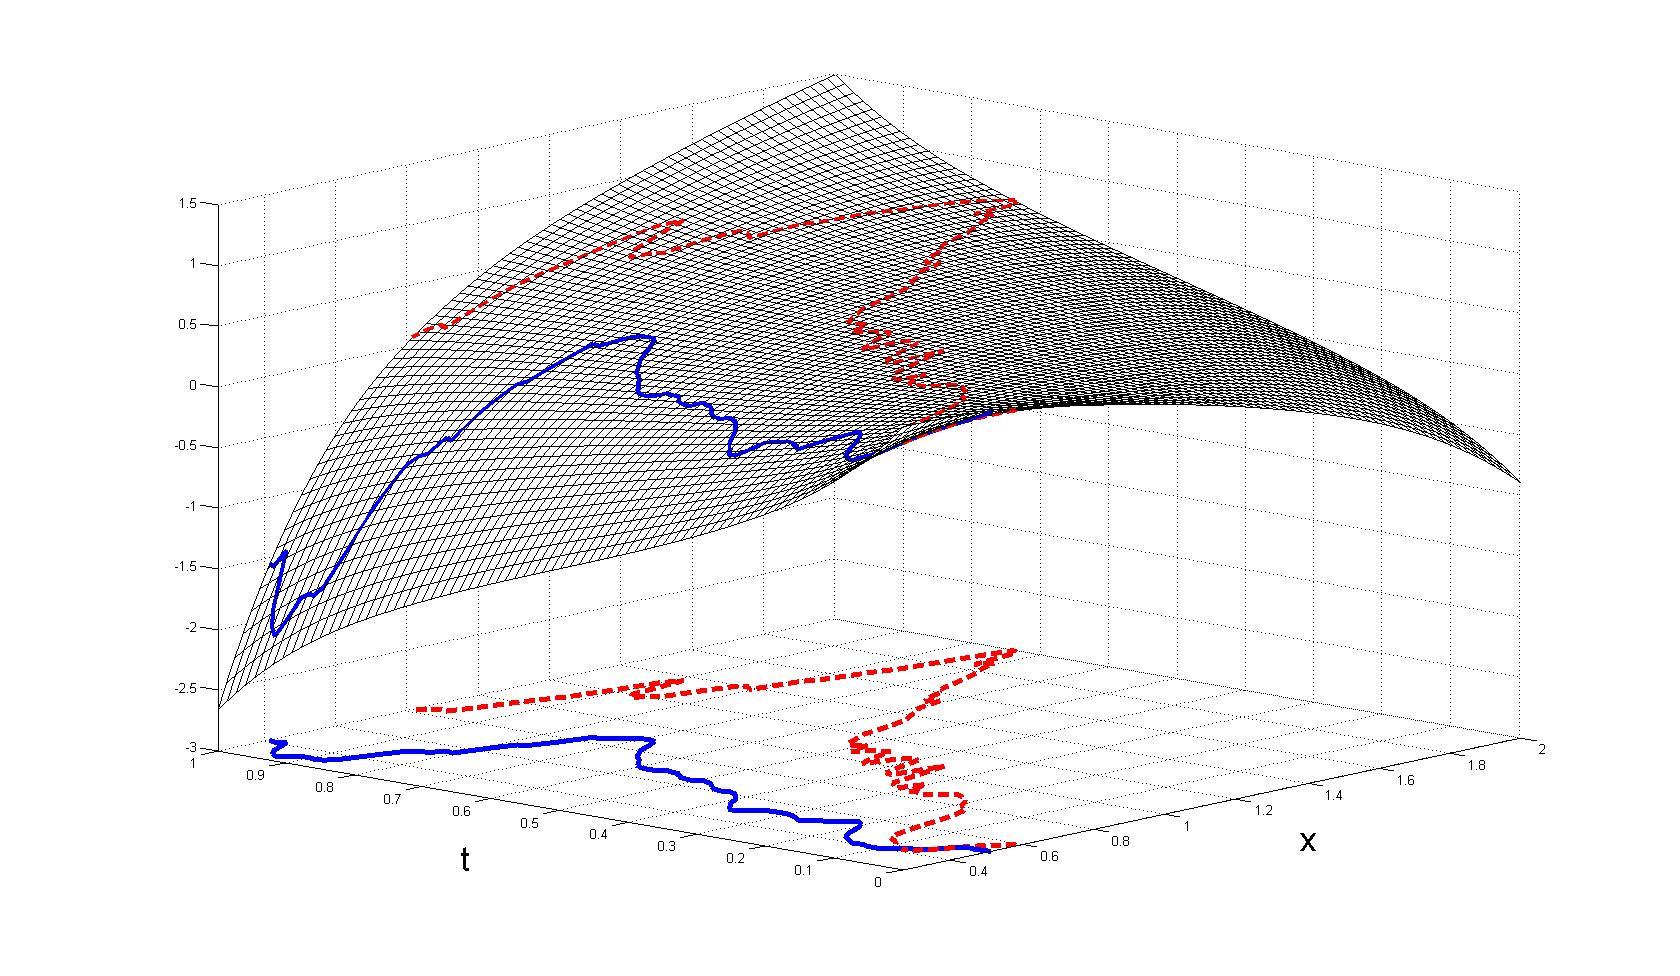
However, this model is often not flexible enough to model the true underlying relationship between the response and predictor. We propose the new model
where F(x,t) is an unknown smooth bivariate function that we estimate using penalized regression splines. The model is much more general than the FLM,
but retains the ease of interpretation. Below is an example estimated surface.
Here Y is 1 if the subject has MS and 0 if they do not and g[E(Y|X)] gives the estimated probability that subject i has MS.
The red plotted curve is X(t) for one subject with MS and blue curve is for a subject without MS. We see that since the red curve traces out a higher path
on the surface than the red curve, the subject corresponding to the red curve is more likely to be classified as having MS.
You may fit the FGAM and FLM yourself to several different data sets using
a Shiny app I created. See the Software tab.
Forecasting EMS Call Arrival Rates
In this project we are interested in determining how to best deploy ambulances in a given city to minimize response times to emergency calls while keeping costs low.
More specifically, we have data on every ambulance trip and every emergency call received by Toronto EMS between January 2007 and December 2008.
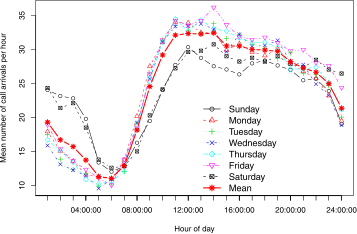
The operations research models that address these deployment problems require accurate estimates of the number of calls that will be received during each time period.
Below is a plot of the mean number of calls per hour for each day of the week.
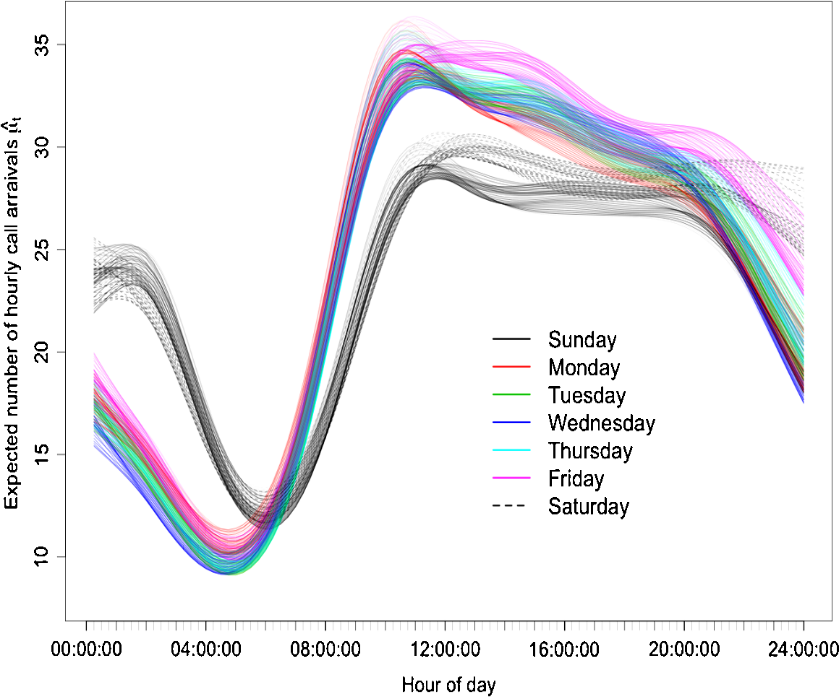
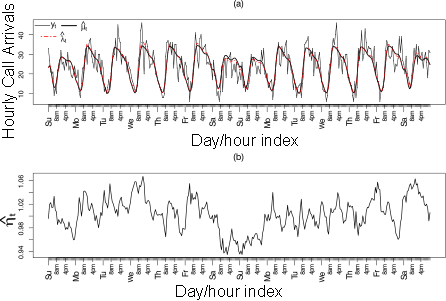
Methods used in practice to obtain estimates are quite ad hoc. Instead, what we do is build what is called a factor model with constraints. This provides dimension reduction, accounts for seasonal and intra-day patterns in the call arrival rate process, and lets us incorporate additional covariates. The factor model is estimated using penalized regression splines so that the factors and loading in the factor model vary smoothly over time. Using the factor model we obtain smooth estimates for the arrival process for every day of 2008 which is plotted below. As is to be expected, there is a very noticeable difference between the estimates for weekdays and weekends.
Finally, an integer-value GARCH model is fit to the residual process to account for any remaining dependence.
Below is a plot of the estimated number of calls for each hour of weeks 8 and 9 of 2007 as well as a plot of the estimated integer-value GARCH model fit to the residual process.
How do we check whether our model improves staffing levels and response times?
By simulating an M/M/s queueing system where the servers
represent ambulances, calls for emergency medical services in
hour, t, occur at rate λt, and each
ambulance services callers at rate ν. We use our model to
obtain estimates of the number of callers for each period and
these determine the number of ambulances to staff, say
st, in each period. After fitting the model to
2007 data, to initialize the queueing system we assume the
number of arrivals each hour is the observed number of calls
for the corresponding hour for 2008 and simulate inter-hour
arrival times and service times for each caller.
RPackages
I have authored and help maintain several R packages for Displayr. These include packages for data
cleaning, regression, machine learning, and choice
modeling. Most of the packages are publicly available on GitHub here.
RefManageR - a Reference Manager for R
RefManageR provides tools for importing and
working with bibliographic references. It greatly enhances
the bibentry class by providing
a class BibEntry which
stores BibTeX and
BibLaTeX references,
supports UTF-8 encoding, and can be easily searched by any
field, by date ranges, and by various formats for name lists
(author by last names, translator by full names, etc.).
Entries can be updated, sorted, combined, printed in a number
of styles, and exported. BibTeX
and BibLaTeX.bib files can be read
into R and converted to BibEntry objects. Interfaces to
NCBI's Entrez,
CrossRef and
Zotero are provided for importing references
and references can be created from locally stored .bib files or PDFs using
Poppler. The package can
also be used in RMarkdown and RHTML
documents for including citations and printing a bibliography
of all cited entries. Both the bibliography and the
citations can include automatically generated hyperlinks.
The package
is available now on CRAN and
a vignette is available
here. The package was peer-reviewed and
accepted by ROpenSci.
The following functions were contributed to
the refund package available on
CRAN
and GitHub:
fgam - a wrapper for the
gam function in package mgcv to fit
functional generalized additive models.
predict.fgam - wrapper for the
predict.gam function in package mgcv
for prediction with fgam fits.
vis.fgam - for visualizing estimated
surfaces produced by fgam.
af - internal function for building fgam
terms specified in model formulas passed to
fgam.
lf - internal function for building
functional linear model terms specified in model formulas
passed to fgam.
To fit FGAM in the latest versions of refund, the
function fgam is deprecated in favour of the
function pfr, which can fit several different scalar
on function regression models including FGAM.
curvHDR
Provided assistance getting
the the R
package accepted to CRAN, including setting up package
namespace and including compiled code.
Shiny Apps
Dynamic Fitting Of Functional Regression Models With Shiny
Below is a Shiny
app I created that performs estimation,
visualization, inference, and prediction for the functional
generalized additive model (FGAM) and the functional linear model
(FLM). More information on these models can be found in the Research
tab and in my papers from the Papers tab. Begin by selecting a data
set and choosing model parameters and an estimation method (if you are
familar with penalized splines). You may also specify options for
displaying the fits, conducting a hypothesis test of FLM vs. FGAM, and
performing out-of-sample prediction. When you have selected the
setting you want, you may fit the models by clicking the "Fit
Models" button. Source code for the app is available
on GitHub.
Article Supplements
Supplementary
material to "Functional Generalized Additive
Models" Includes examples for fitting FGAM and code
from conducting all simulations in the paper. Note that
changes to the splines package in R
means this code no longer runs in current versions
of R. Those interested in fitting an FGAM should
see the pfr function in the
package refund.
Supplementary
material to "Forecasting EMS Call Arrival
Rates" Includes code for estimating the combined
factor model and Integer-GARCH model as well as code for
conducting the queueing system simulation study.
Below is a sampling of blog posts I wrote in a previous
role. They aim to describe aspects of R, choice modelling, and
using the software Q and Displayr for a general audience of
non-programmers and data scientists.
A complete list of my posts with better styling can be found
on
the Displayr
blog.
How to Improve Choice Model Accuracy Using CovariatesEasily Converting Strings to Times and Dates in R with flipTimeHow to Create a Pseudo-Package in Displayr